
Phoenix Market Watch: The Million-Dollar Exception
What the slowdown headlines aren’t telling you.
November 5, 2026 · 6 min read · Monthly edition

key takeaways
- Year to date, resale sales fell below $1 million and rose above it.
- New builds averaged $249.70 per square foot, about 15% less than resales at $294.07.
- The median resale closed at 96.6% of its original asking price. Check your home’s value before you set a price.
The Phoenix housing slowdown has a million-dollar exception.
Below $1 million, resale sales are down. Above that mark, they’re up. Meanwhile, new builds sold for less per square foot on average than resales, and the typical resale closed below its original asking price.
Try fitting all of that into a headline that says “the market is slowing down.”
Those findings come from the ARMLS/RapidStats figures used here for detached single-family sales through November 3, 2026. They give buyers and sellers a reason to look closer before assuming they know what this market will do for them.
If you’re selling a $550,000 house, a busier million-dollar market won’t price it for you. And if you’ve ruled out new construction because you assume it costs more, the price-per-square-foot comparison deserves a look. Here’s what I’d want you to consider before we set a price or write an offer.
Phoenix-Area Housing Market by City: October 2026
Find your city below for a quick look at October activity. This table covers the completed month; the price-range and pricing comparisons that follow cover year-to-date sales through November 3.
| City | Closed | vs Sep | vs Oct 2025 |
|---|---|---|---|
| Phoenix | 716 | -3.24% | -14.66% |
| Scottsdale | 308 | +0.00% | -12.75% |
| Mesa | 284 | -23.66% | -31.57% |
| Chandler | 190 | -14.80% | -22.13% |
| Gilbert | 185 | -22.59% | -25.40% |
| Tempe | 49 | -23.44% | -33.78% |
| Queen Creek | 78 | -4.88% | -28.44% |
| San Tan Valley | 168 | -28.81% | -36.36% |
| Glendale | 155 | -13.41% | -11.43% |
| Peoria | 157 | -15.14% | -15.14% |
| Surprise | 241 | -6.23% | -20.46% |
| Goodyear | 114 | -25.97% | -16.79% |
| Buckeye | 185 | -26.00% | -11.90% |
Month over month compares October with September. Year over year compares October with the same month last year. Read them together: a one-month change can reflect seasonal patterns as well as a change in activity.
Source: ARMLS/RapidStats, Market Statistics Summary for October 2026, retrieved November 4, 2026. Detached single-family homes; all transaction types. Each row uses the report’s named city filter, all available ZIP codes and no county restriction. City labels follow ARMLS classifications and may differ from mailing addresses. Active listings are the report’s October inventory measure; new listings and closed sales are October activity. Month-over-month sales changes compare October 2026 with September 2026; year-over-year changes compare October 2026 with October 2025. These are unadjusted comparisons, not seasonally adjusted trends. Figures reflect the report’s available data and may be revised. These selected areas do not represent the entire Phoenix metro area.
Resale Activity Split at the Million-Dollar Mark
Below $1 million, every price band in the resale report recorded fewer sales than during the same period last year. Starting at $1 million, every reported band recorded more.
Combining the report’s price bands shows the split:
Below $1 million: 33,758 vs. 34,428 (−1.9%)
$1 million and above: 5,035 vs. 4,709 (+6.9%)
Based on information from the Arizona Regional Multiple Listing Service for the periods Jan 1 through Nov 3, 2026 and Jan 1 through Nov 3, 2025.
These totals combine the detached single-family, normal-sale/resale price bands in the ARMLS/RapidStats report.
The overall resale count was down less than 1% year to date. Within that total, the highest reported band, $1.75 million and above, recorded an increase of approximately 11.9%.
What That Means for Sellers
If you’re selling a $550,000 house, stronger activity above $1 million doesn’t establish that demand for your property is equally strong.
The reverse is also true. A broad slowdown headline doesn’t mean every higher-priced house is struggling.
Start with the homes buyers would realistically compare with yours: similar location, size, condition and price range. Then examine the competition and recent sales within that group.
These are completed sales. To judge your chances of selling, we also need to look at available inventory and how your home compares. More sales alone don’t tell us how much room a seller has to negotiate.
For buyers, fewer sales don’t automatically mean a seller will accept a deep discount. We still need to look at the property, its competition and what we know about the owner’s situation before deciding what to offer.
New Builds Sold for Less Per Square Foot
In the year-to-date detached single-family data, normal-sale/resale houses averaged $294.07 per square foot. New builds averaged $249.70, approximately 15.1% less.
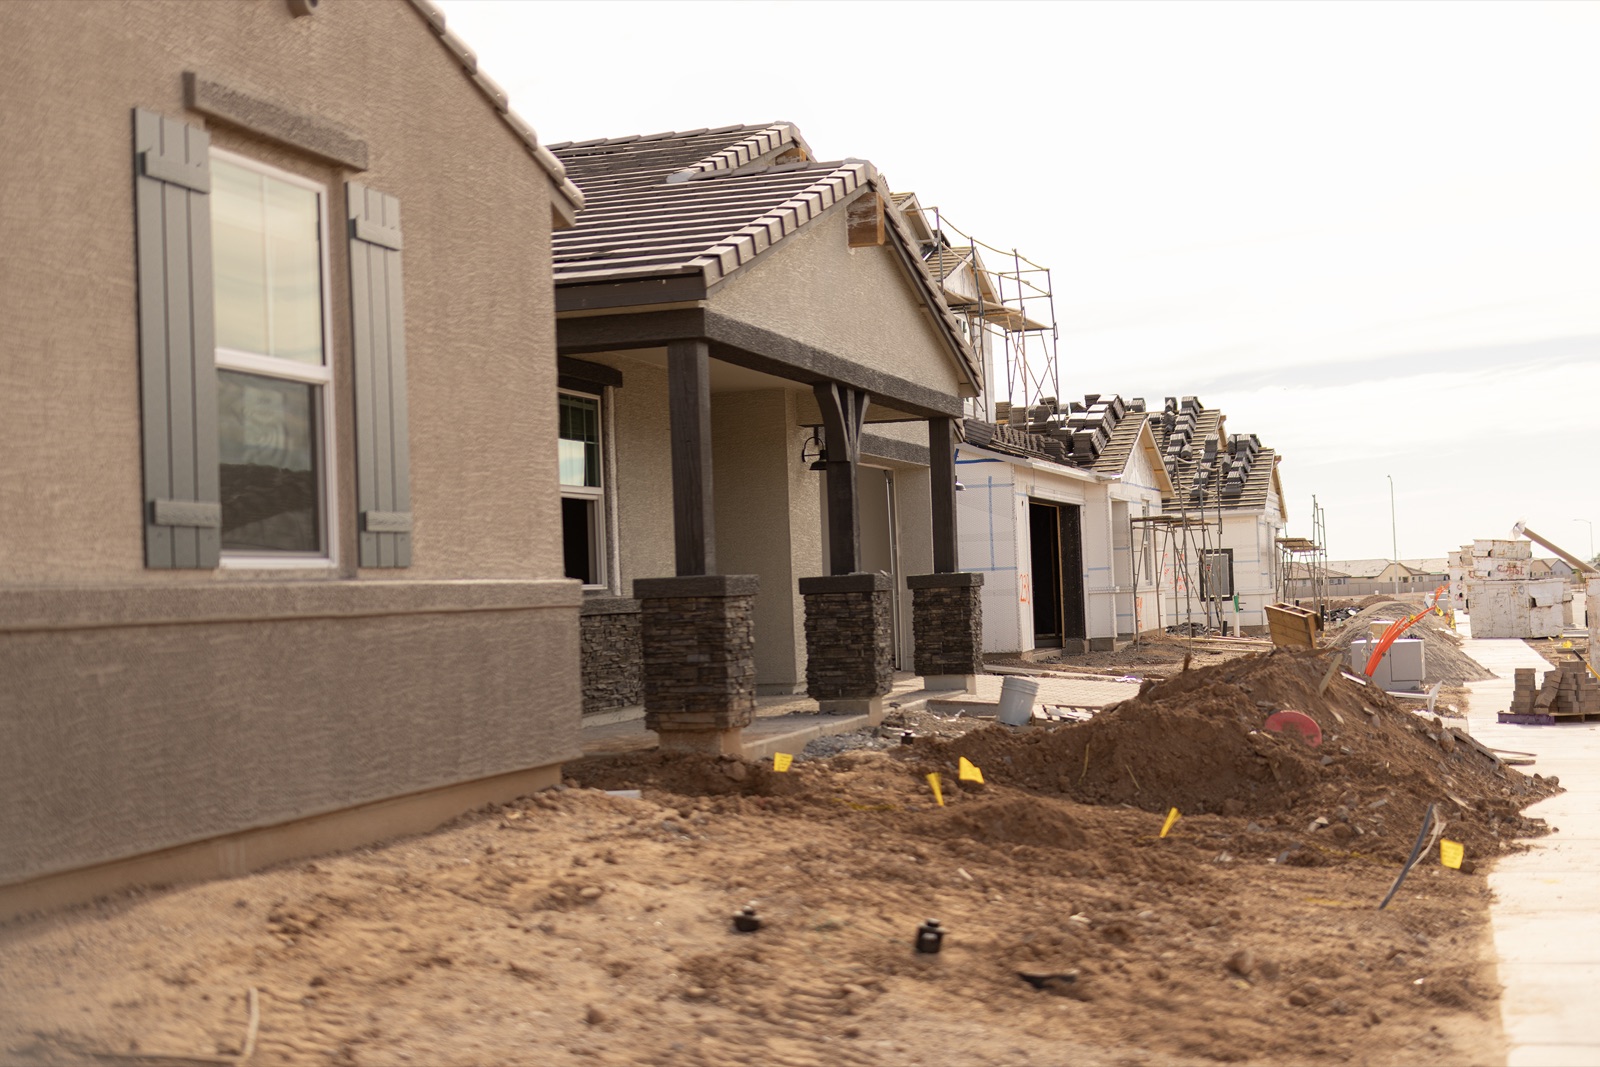
Based on information from the Arizona Regional Multiple Listing Service for the period Jan 1 through Nov 3, 2026.
Figures cover January 1–November 3, 2026, across the report’s detached-house categories.
Before treating that difference as a discount, we need to look at which homes are in each group.
Less Per Foot Doesn’t Necessarily Mean Less Overall
This comparison does not control for location, house size, lot size, construction quality or amenities. It also does not isolate the effect of age within the resale category.
You can’t assume a comparable new house costs 15% less from these averages. A lower price per square foot also doesn’t necessarily mean a lower total purchase price.
If you’re open to both new construction and resale, compare the homes you could buy.
Build a side-by-side worksheet that includes:
- Purchase price and included features.
- Lot premiums and upgrades.
- Financing terms and any conditions attached to incentives.
- HOA dues and other recurring charges.
- Landscaping, window coverings and other move-in expenses.
- Condition of major systems and anticipated repairs.
- Commute, location and expected completion or move-in timing.
Include the costs that apply to each property so you can see how the purchases compare.
Resale Sellers Should Check the Alternatives
If your likely buyers are also considering nearby new construction, include those communities in your research.
Look at what buyers can purchase, what is included and what the financing offer requires. A builder’s advertised starting price may leave out costs that matter to the buyer. Your established neighborhood may offer advantages, too. We need to understand how your house compares with those alternatives.
What Sellers Received Compared With Their Asking Prices
The median resale closed at 96.6% of its original asking price, about 3.4% below it. The underlying median sold-to-original-list-price ratio was 96.64% for detached single-family resales closed year to date.
Based on information from the Arizona Regional Multiple Listing Service for the period Jan 1 through Nov 3, 2026.
That doesn’t mean sellers should add 3.4% to their desired price or buyers should deduct it from every listing. We need to look at how the individual home is priced.
The Gap Doesn’t Tell the Whole Negotiation Story
A sale below the original asking price might involve price reductions before an offer, a negotiated purchase price, or both. The original-to-sale ratio alone doesn’t establish the sequence.
It also does not measure seller-paid closing costs or other concessions. We need to review those separately when comparing offers or recent sales.
For Sellers: Make the Starting Number Defensible
Before choosing an asking price, ask:
- Which recent sales support it?
- How do those properties compare with yours?
- What competing listings will buyers see?
- What changes in condition, location or features justify a difference?
- What evidence would trigger a pricing review?
Choose a starting price you can support, with a plan for reviewing it as buyers respond.
For buyers, a house that has already reduced its price may be positioned differently from one that just entered the market.
Review its pricing history, condition and comparable sales. Consider the complete offer, including financing and requested concessions, without treating the report’s median as a negotiating formula.
How I’d Use These Numbers With You
| Finding | The question it should prompt |
|---|---|
| Resale activity increased above $1 million while declining below it | What is happening in my actual price range? |
| New builds averaged less per square foot than resales | Am I comparing the complete cost and benefits of the available homes? |
| The median resale closed below its original asking price | Is this asking price supported, and what does the pricing history tell me? |
Some transaction classifications may be revised as reporting catches up. These figures are a starting point; we should recheck the reports before using them to make a pricing or offer decision.
Source and scope: Based on information from the Arizona Regional Multiple Listing Service, as reported by ARMLS RapidStats for November 2026. Figures cover January 1–November 3, 2026, with the corresponding 2025 period where indicated. Detached single-family houses only. “Resale” refers to the report’s Normal Sale transaction category. Derived totals are calculated from the report’s figures. These comparisons do not constitute an appraisal or predict an individual property’s results.
read next
what’s happening in your price range?
If you’re considering a move, send me the area and property type you have in mind. We can look at recent sales, current competition and your plans before you commit to a price or an offer.